

私にとって、16ビットヒストグラムはSilverFastの最も重要な機能のひとつです。この機能は画像のハイライトとシャドウを設定するための完璧なツールです。
ヒストグラムとは、データの分布を統計的にグラフ化したものです。画像処理では、グレー値やカラー値の階調分布を表示する際に適しています。
ヒストグラムは、デジタル画像の明度値の分布を視覚化し、コントラスト範囲と明度を推測します。 ヒストグラムは、露出不足や露出オーバーのような典型的な画像エラーを認識し、修正するための優れたツールです。 そのため、ヒストグラムはSilverFastの最も重要な機能の一つとなっています。
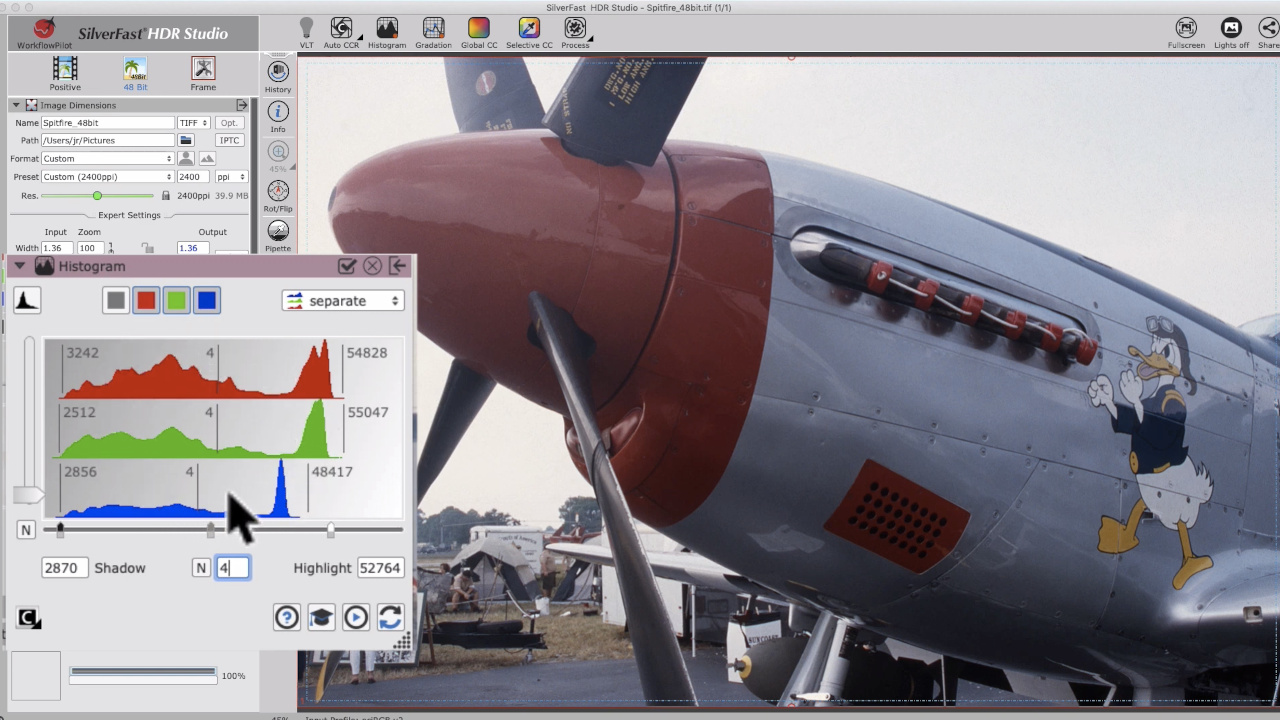
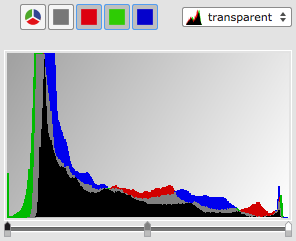
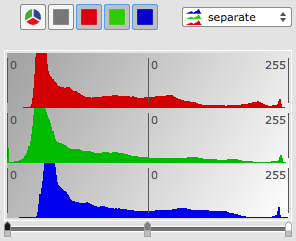
SilverFastヒストグラムは、異なるモードで表示することができます: 3つのカラーチャンネルすべての組み合わせから作成された加算表現と、3つのカーブをオーバーレイとして透過的に表現、そして3つ別々のカーブ表現。また、RGBとCMYの表示を切り替えることもできます。
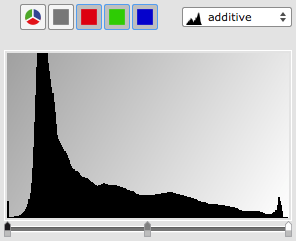
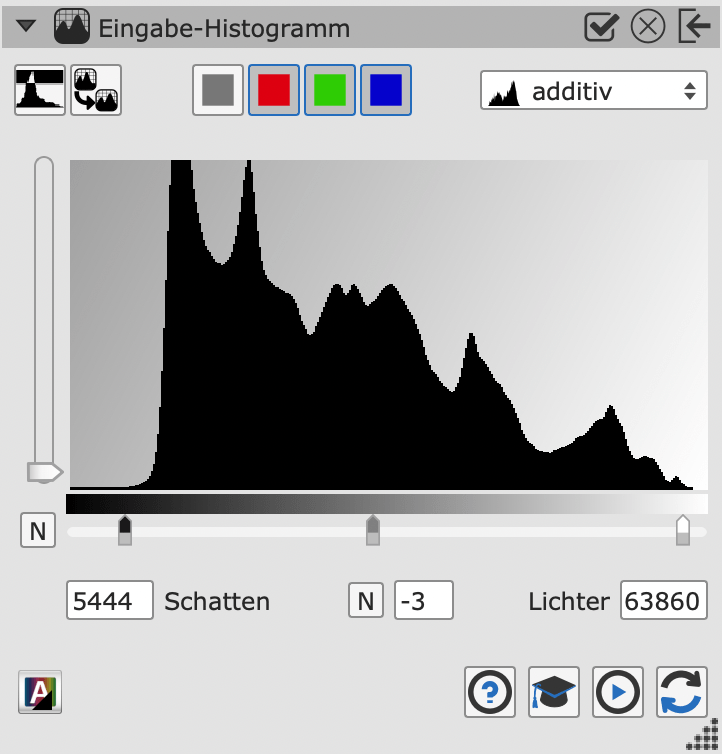
通常のヒストグラム(加算表示)は、3つのRGBチャンネルすべてを含むため、ハイライトとシャドウをすばやく調整できます。
ヒストグラムを透明に重ねて表示することで、各色チャンネルの輝度値の関連性を確認することができます。
RGB分離表示では、ハイライトとシャドウを色チャンネルごとに個別に設定し、色かぶりをなくすことができます。
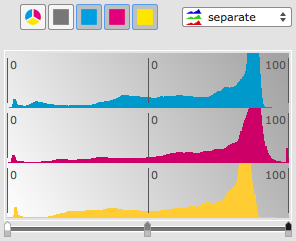
CMY分離表示では、明度は左の0%(明るい)から右の100%(暗い)までです。これは、多くのユーザーにとって分かりやすくなっています。
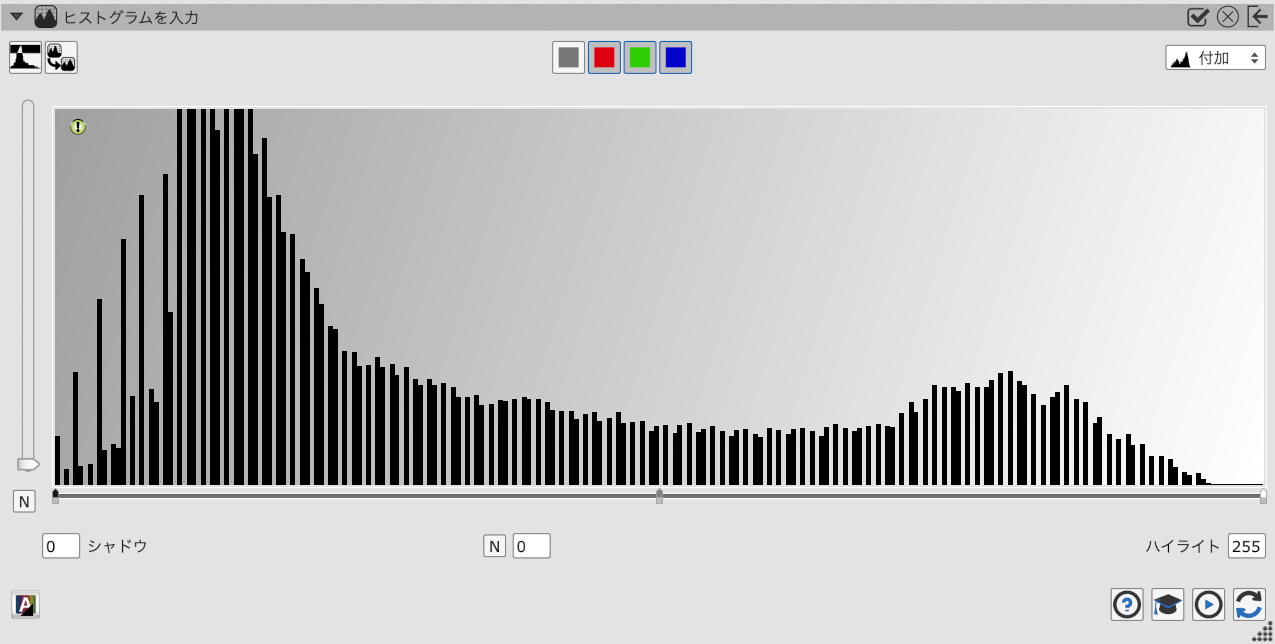
一見正常に見える画像も、時には非常に重大な画像エラーが見られることがあります。露出不足の画像を大幅に明るくすると、ヒストグラムにギャップが生じることがよくあります。他の画像処理作業でもヒストグラムが損傷し、画像の品質が損なわれることがあります。
ギャップが多いヒストグラムは、トーンレンジの低い画像を表しています。このようなエラーは、SilverFastを使えば非常に簡単に判別できます。ヒストグラムツールウィンドウをドックから外し、マウスでウインドウを大きくするだけです。
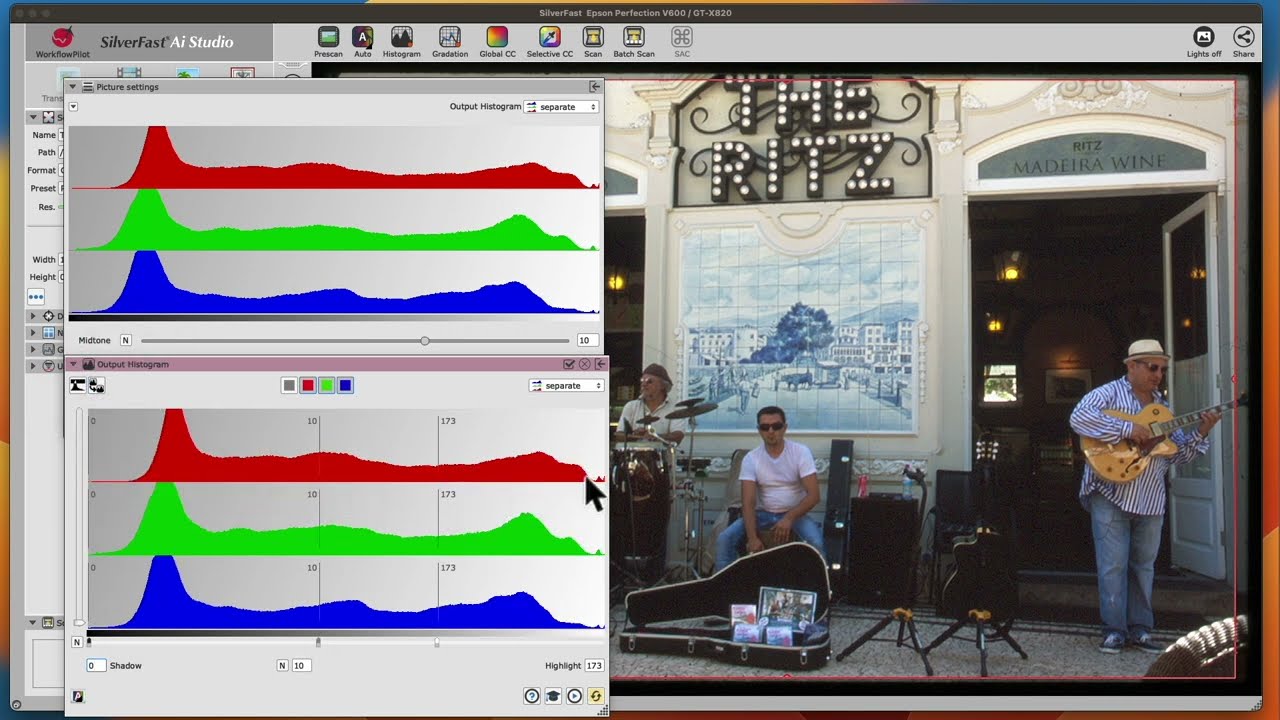
SilverFast で画像を編集するときは、画像のヒストグラムがそのまま残っていることを確認してください。出力ヒストグラムでいつでも画像の変更をトレースすることができます。
ヒント: SilverFast Ai StudioとHDR Studioでは、デンシトメータのダイアログウィンドウのエキスパート設定で16ビットヒストグラムに切り替えることができます。
ヒント: ヒストグラムダイアログでは、”ALT “キーを押すことでいつでも出力ヒストグラムを表示できます。
私にとって、16ビットヒストグラムはSilverFastの最も重要な機能のひとつです。この機能は画像のハイライトとシャドウを設定するための完璧なツールです。